Compensation Tables (continued)
Potential Payments upon Termination or Change in Control
The information below describes and quantifies certain compensation and benefits that would have become payable (in certain cases subject to conditions such compliance with restrictive covenants and an effective release of claims) to each of our NEOs if our NEO’s employment had terminated on December 31, 20212023 (and that a Change in Control occurred on
Frontier Airlines 2024 Proxy Statement 43
EXECUTIVE COMPENSATION TABLES (continued)
December 31, 2021,2023, as applicable) as a result of each of the termination scenarios described below, taking into account the NEO’s compensation as of that date, and does not reflectreflects the acceleration benefits under the Change in Control Policy, which was adopted in February 2022. The information below does not generally reflect compensation and benefits available to all salaried employees upon termination of employment with us under similar circumstances. Capitalized terms used below are as defined above in the applicable NEO’s employment agreement or offer letter agreement. In the case of Mr. Diamond, the benefits set forth in the table below give effect to the benefits provided under his new offer letter agreement entered into in February 2024, as though it was in effect as of December 31, 2023.
| | | | | | | | | | | | | | | | | | | | | | | |
| Name | Termination
Scenario | Base
Salary
Severance
($) | Termination
Scenario
Bonus
Severance
($) | | | Base
Salary
Severance
($)
| | | Bonus
Severance
($)
| | | Accelerated
Vesting of
Stock and
Option
Awards
($)
| COBRA
Premiums
($) | Other
($) | COBRA
Premiums
Total
($) | | | Other
($)
| | | Total
($)
|
Barry L. Biffle | | | Termination without Cause or for Good Reasona Constructive Termination | 680,000(1) | 1,498,146(2) | — | | 26,494(3) | 625,000(1)11,000(4)
| 2,215,640 | |
| Termination without Cause or a Constructive Termination in Connection with a Change in Control | 1,566,016(2)1,360,000(5)
| | 2,344,556(6) | —5,875,671(7)
| | 52,988(8) | 25,914(3)22,000(9)
| 9,655,215 | |
| James G. Dempsey | Termination without Cause | 11,000(4)625,000(1)
| 540,561(2) | — | | 32,220(3) | 2,227,9308,250(4)
| 1,206,031 | |
Termination without Cause or a Constructive Termination in Connection with a Change in Control | 1,250,000(5) | 1,502,557(6) | 4,437,768(7) | 64,440(8) | 16,500(9) | 7,271,265 | |
| Howard M. Diamond | Termination without Cause | 440,000(1) | 306,504(2) | — | | — | | 8,250(4) | 754,754 | |
| Termination without Cause or for Good Reason in Connection with a Change in Control | 880,000(5) | | 613,008(6) | 1,250,000(5)1,589,035(7)
| — | | 2,347,266(6)16,500(9)
| 3,098,543 | | 4,684,771(7)
| | | 51,828(8)
| | | 22,000(9)
| | | 8,355,865
|
James G. Dempsey
Mark C. Mitchell | | | Termination without Cause | 465,000(1) | | | 525,000(1)218,857(2)
| — | | — | | 472,500(2)8,250(4)
| 692,107 | | —
| | | 31,144(3)
| | | 8,250(4)
| | | 1,036,894
|
| Termination without Cause or for Good Reason in Connection with a Change in Control | 930,000(5) | | 437,714(6) | 1,050,000(5)1,748,642(7)
| — | | 1,419,627(6)16,500(9)
| 3,132,856 | | 1,821,458(7)
| | | 62,288(8)
| | | 16,500(9)
| | | 4,369,873
|
Howard M. Diamond
Trevor J. Stedke | | | Termination without Cause | 380,000(1) | | | 400,000(1)246,486(2)
| — | | — | | 280,000(2)8,250(4)
| 634,736 | | —
| | | —
| | | 8,250(4)
| | | 688,250
|
| Termination without Cause or for Good Reason in Connection with a Change in Control | 760,000(5) | | 492,972(6) | 800,000(5)1,427,593(10)
| — | | 560,000(6)16,500(9)
| 2,697,065 | | 1,295,854(10)
| | | —
| | | 16,500(9)
| | | 2,672,354
|
Craig R. Maccubbin
Rajat Khanna | | | Termination without Cause | 370,000(1) | | 240,500(2) | 360,000(1)391,015(11)
| — | | 198,000(2)8,250(4)
| 1,009,765 | | —
| | | —
| | | 8,250(4)
| | | 566,250
|
| Termination without Cause or for Good Reason in Connection with a Change in Control | 740,000(5) | | 481,000(6) | 720,000(5)2,417,186(10)
| — | | 396,000(6)16,500(9)
| 3,654,686 | | 722,847(10)
| | | —
| | | 16,500(9)
| | | 1,855,347
|
Jake F. Filene
| | | Termination without Cause
| | | 360,000(1)
| | | 234,000(2)
| | | —
| | | —
| | | 8,250(4)
| | | 602,250
|
| Termination without Cause or for Good Reason in Connection with a Change in Control
| | | 720,000(5)
| | | 468,000(6)
| | | 1,124,139(10)
| | | —
| | | 16,500(9)
| | | 2,328,639
|
(1)
| Represents a lump sum cash payment of 12 months of base salary. |
(2)
| Represents a lump sum cash payment of one times the NEO’s target annual performance bonus amount. In addition, for Mr. Biffle, represents a pro-rated annual performance bonus for the year in which the termination occurs (based on actual performance and payable at the same time other continuing executives) in the event of a termination without Cause or for Good Reason. For Mr. Biffle’s pro-rated bonuses, we included the full amount he was paid for fiscal year 2021 under the Management Bonus Plan since the assumed termination date would be December 31, 2021. |
(3)
| Represents continued coverage under COBRA for 12 months for each NEO based on the incremental cost of our contribution as of December 31, 2021 to provide this coverage. Messrs. Diamond, Maccubbin and Filene are not eligible for any continued coverage under COBRA. |
(4)
| Represents the value of continued UATP flight benefits for one year following the NEOs’ termination of employment, which must be used in the year following termination, based on the values each NEO was eligible to receive under the UATP for fiscal 2021. |
(1)Represents a lump sum cash payment of 12 months of base salary.
48 Frontier Airlines. 2022 Proxy Statement
|
(2)Represents a lump sum cash payment of one times the NEO’s target annual performance bonus amount. In addition, for Mr. Biffle, represents a pro-rated annual performance bonus for the year in which the termination occurs (based on actual performance and payable at the same time other continuing executives) in the event of a termination without Cause or a Constructive Termination. For Mr. Biffle’s pro-rated bonuses, we included the full amount he was paid for fiscal year 2023 under the Management Bonus Plan since the assumed termination date would be December 31, 2023.(3)Represents continued coverage under COBRA for 12 months for each NEO based on the incremental cost of our contribution as of December 31, 2023 to provide this coverage. Messrs. Diamond, Mitchell, Stedke and Khanna are not eligible for continued coverage under COBRA.
(4)Represents the value of continued UATP flight benefits for one year following the NEO’s termination of employment, which must be used in the year following termination, based on the values each NEO was eligible to receive under the UATP for fiscal 2023.
44Frontier Airlines 2024 Proxy Statement
EXECUTIVE COMPENSATION TABLES (continued)
(5)Represents a lump sum cash payment of 24 months of base salary.
(6)Represents a lump sum cash payment of two times a NEO’s target annual performance bonus amount. In addition, for Messrs. Biffle and Dempsey, represents a pro-rated annual performance bonus for the year in which the termination occurs (based on actual performance and payable at the same time other continuing executives) in the event of a termination without Cause or for Good Reason. For Messrs. Biffle’s and Dempsey’s pro-rated bonuses, we included the full amount each was paid for fiscal year 2023 under the Management Bonus Plan since the assumed termination date would be December 31, 2023.
(7)Represents the aggregate value of Mr. Biffle’s, Mr. Dempsey’s, Mr. Diamond’s and Mr. Mitchell’s RSUs that would have vested on an accelerated basis immediately prior to a qualifying termination following the consummation of a Change in Control, based on the closing trading price of our common stock ($5.46) as of December 29, 2023. Mr. Biffle, Mr. Dempsey, Mr. Diamond and Mr. Mitchell each receive 100% accelerated vesting of their respective equity awards in the event of a termination without Cause, or a Constructive Termination or termination for Good Reason, as applicable, in each case, within 12 months following a Change in Control. In addition, as disclosed above, under the 2014 Plan, the awards granted under that plan will fully accelerate immediately prior to a Change in Control, and under the 2021 Plan, the awards granted under that plan will fully accelerate on a Change in Control if not assumed or substituted. Additionally, the RSU agreements for RSUs granted under the 2021 Plan subsequent to October 2023 provide for full acceleration on a termination without Cause within 12 months following a Change in Control.
(8)Represents continued coverage under COBRA for 24 months for each NEO based on the incremental cost of our contribution as of December 31, 2023 to provide this coverage. Messrs. Diamond, Mitchell, Stedke and Khanna are not eligible for continued coverage under COBRA.
(9)Represents the value of continued UATP flight benefits for two years following the NEOs’ termination of employment, within 12 months following a Change in Control, which must be used in the two years following termination, based on the values each NEO was eligible to receive under the UATP for fiscal 2023.
(10)Represents the aggregate value of RSUs held by Messrs. Stedke and Khanna that would have vested in full on a termination without “cause” or resignation for “good reason” in connection with a qualifying change in control under the Change in Control Policy based on the closing trading price of our common stock ($5.46) as of December 29, 2023. In addition, as disclosed above, under the 2014 Plan, the awards granted under that plan will fully accelerate immediately prior to a Change in Control, and under the 2021 Plan, the awards granted under that plan will fully accelerate on a Change in Control if not assumed or substituted. Mr. Khanna's offer letter provides that the vesting of his initial grant of RSUs will fully accelerate upon the consummation of a Change in Control, which would have a value of $1,564,061 and would be paid in cash if a Change of Control had occurred on December 31, 2023. Additionally, the RSU agreements for RSUs granted under the 2021 Plan subsequent to October 2023 provide for full acceleration on a termination without Cause within 12 months following a Change in Control.
(11)Mr. Khanna’s offer letter agreement provides that if he is terminated without Cause within the first 12 months of employment, he is entitled to the cash equivalent of the market value of the first 25% vesting tranche of his initial grant of RSUs.
Frontier Airlines 2024 Proxy Statement 45
EXECUTIVE COMPENSATION TABLES (continued)
CEO Pay Ratio
As required by Section 953(b) of the Dodd-Frank Wall Street Reform and Consumer Protection Act, and Item 402(u) of Regulation S-K, we are providing information about the relationship of the annual total compensation of our employees and the annual total compensation of our Chief Executive Officer.
For the year ended December 31, 2023 the annual total compensation of our Chief Executive Officer, as set forth in the Summary Compensation Table, was $8,582,703, and the median of the annual total compensation of all employees, other than our Chief Executive Officer, was $54,592, resulting in a ratio of 157:1 (the “pay ratio”).
This pay ratio is a reasonable estimate calculated in a manner consistent with Item 402(u) of Regulation S-K. We chose December 31, 2023 as the date for establishing the employee population used in identifying the median employee and 2023 as the measurement period. We captured all full time, part-time, and temporary employees globally as of December 31, 2023.
We identified the median employee annual compensation using W-2 reportable wages as of December 31, 2023. The annual total compensation of the median employee and the annual total compensation of the Chief Executive Officer were calculated in accordance with the requirements of Item 402(c)(2)(x) of Regulation S-K.
The SEC’s rules for identifying the median compensated employee and calculating the pay ratio based on that employee’s annual total compensation allow companies to adopt a variety of methodologies, to apply certain exclusions, and to make reasonable estimates and assumptions that reflect their employee populations and compensation practices. As a result, the pay ratio reported by other companies may not be comparable to the pay ratio reported above, as other companies have different employee populations and compensation practices and may utilize different methodologies, exclusions, estimates, and assumptions in calculating their own pay ratios.
46Frontier Airlines 2024 Proxy Statement
EXECUTIVE COMPENSATION TABLES (continued)
Pay Versus Performance
Pay Versus Performance Tables
The following table sets forth information concerning the compensation of our NEOs for each of the fiscal years ended December 31, 2023, 2022 and 2021, and our financial performance for each such fiscal year:
| | | | | | | | | | | | | | | | | | | | | | | | | | |
| Year | Summary Compensation Table Total for PEO(1) ($) | Compensation Actually Paid to PEO(1)(3) ($) | Average Summary Compensation Table Total for Non-PEO NEOs(2) ($) | Average Compensation Actually Paid to Non-PEO NEOs(2)(3) ($) | Value of Initial Fixed $100 Investment Based on: | Net Income (Loss) (millions) ($) | Adjusted Pre-Tax Margin(5) ($) |
Total Stockholder Return (“TSR”) ($) | Peer Group TSR(4) ($) |
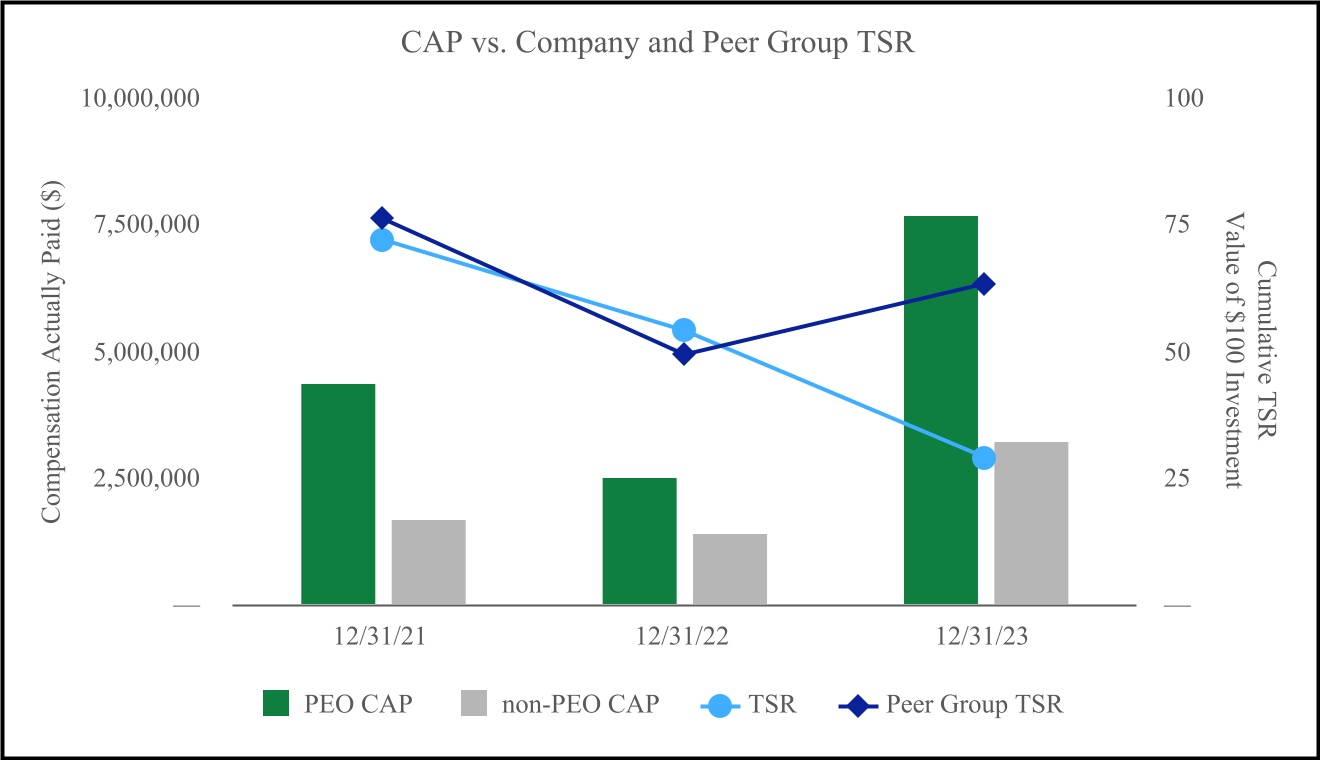
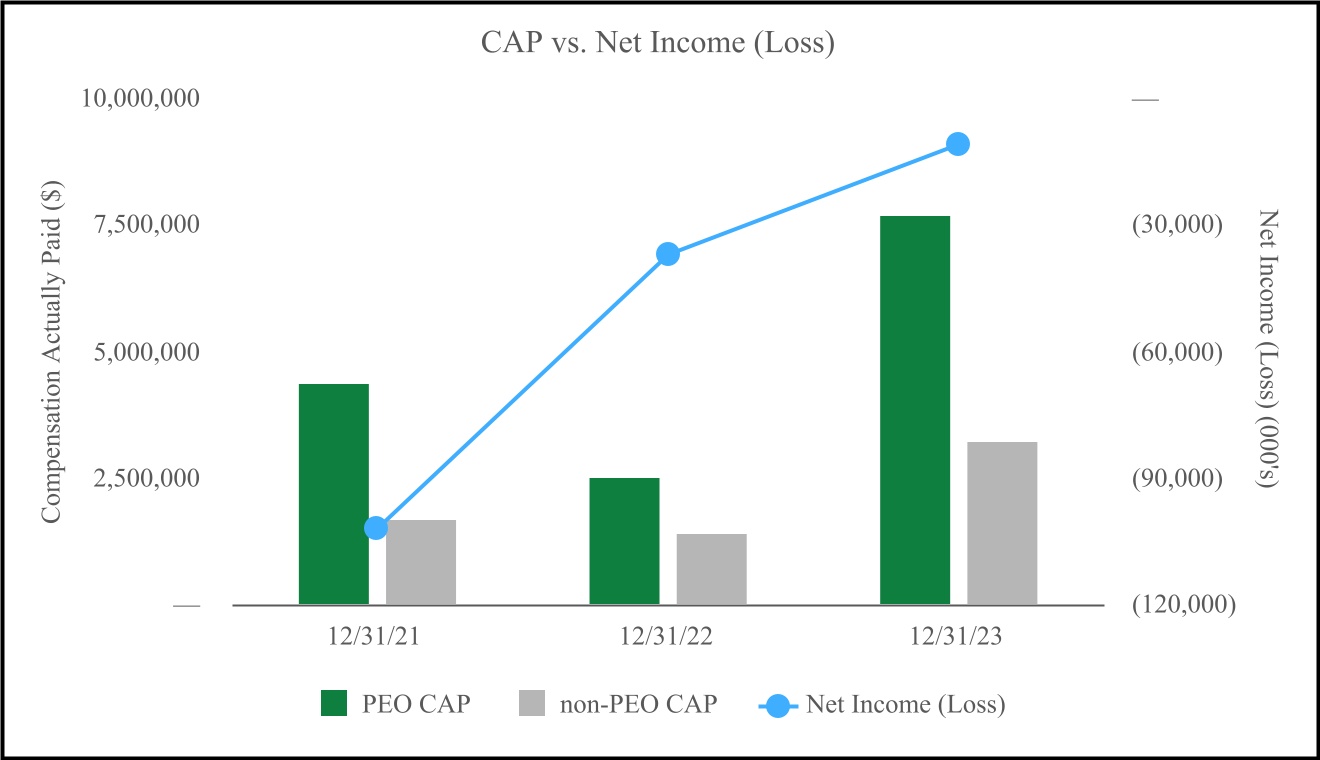
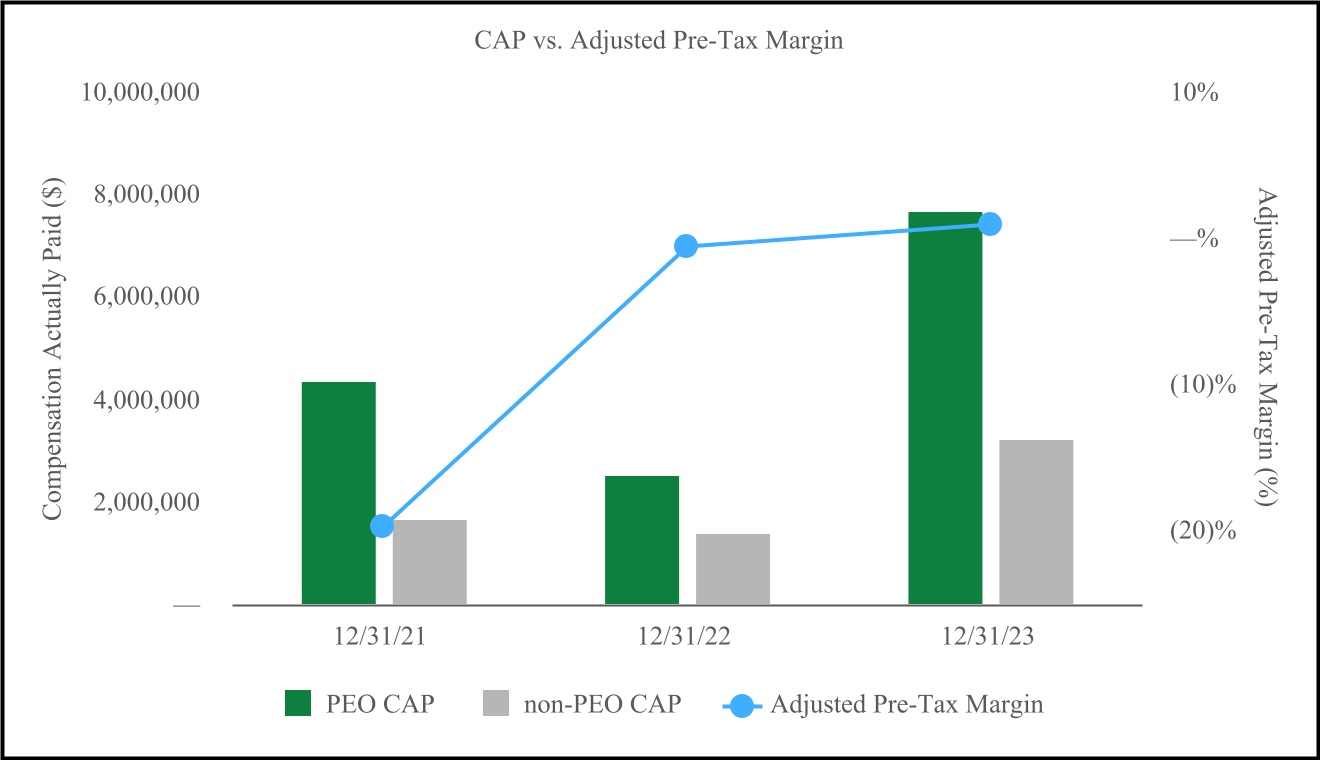
| 2023 | 8,582,703 | 7,693,635 | 3,067,768 | 3,246,609 | 29 | 63 | (11) | 1% |
| 2022 | 3,747,416 | 2,548,608 | 1,794,258 | 1,419,035 | 54 | 49 | (37) | (1)% |
| 2021 | 3,598,210 | 4,372,050 | 1,412,615 | 1,685,241 | 72 | 76 | (102) | (20)% |
(1)The Principal Executive Officer (“PEO”) in fiscal years 2023, 2022 and 2021 is Barry L. Biffle.
(2)The NEOs included in the calculation of average NEO compensation in the respective fiscal years are as follows:
2023: James G. Dempsey, Howard M. Diamond, Mark C. Mitchell, Trevor J. Stedke, and Rajat Khanna
2022: James G. Dempsey, Craig R. Maccubbin, Trevor J. Stedke, and Jake F. Filene.
2021: James G. Dempsey, Howard M. Diamond, Craig R. Maccubbin, and Jake F. Filene.
(3)Fair value or change in fair value, as applicable, of equity awards in the “Compensation Actually Paid” columns was determined by reference to (i) for RSU awards, the closing price per share on the applicable year-end date(s) or, in the case of vesting dates, the closing price per share on the applicable date(s); and (ii) for stock options, a Black-Scholes value as of the applicable year-end or vesting date(s), determined based on the same methodology as used to determine grant date fair value but using the closing stock price on the applicable revaluation date as the current market price and with an expected life equal to the original ratio of expected life relative to the ten-year contractual life multiplied times the remaining life as of the applicable revaluation date, and in all cases based on volatility and risk free rates determined as of the revaluation date based on the expected life period and based on an expected dividend rate of 0%.
(4)For the relevant fiscal year, represents the cumulative TSR (the “Peer Group TSR”) of the NYSE ARCA Airline Index (XAL) (the “Peer Group”).
(5)Adjusted Pre-Tax Margin is a non-GAAP measure and represents adjusted pre-tax income (loss), a non-GAAP measure, divided by revenues, a GAAP measure. Adjusted pre-tax income (loss) represents pre-tax income (loss), a GAAP measure, adjusted for special items. The sum of these non-GAAP adjustments is referred to as the “pre-tax impact.” See “Management's Discussion and Analysis of Financial Condition and Results of Operations—Results of Operations” in our 2023 Annual Report, which accompanies this proxy statement, for a reconciliation of adjusted net income (loss) to the corresponding GAAP measure, which includes the adjusting items that comprise the pre-tax impact (pages 66-68) and the related discussion of adjusting items (pages 64-65). While we use numerous financial and non-financial performance measures to evaluate performance under our compensation programs, Adjusted Pre-Tax Margin (the most significant and operational component of Adjusted Net Margin) is the financial performance measure that, in our assessment, represents the most important performance measure (that is not otherwise required to be disclosed in the table) used to link CAP to our NEOs to our performance. We believe it is a useful indicator to compare the profitability of our business against industry peers of different sizes and derivations of pre-tax income (loss) are well-recognized performance measurements in the airline industry that are frequently used by our management, as well as by investors. Adjusted Pre-Tax Margin is not determined in accordance with GAAP, may not be comparable across all carriers, and should not be considered in isolation or as a substitute for performance measures calculated in accordance with GAAP.
Frontier Airlines 2024 Proxy Statement 47
EXECUTIVE COMPENSATION TABLES (continued)
Compensation actually paid (“CAP”) to our NEOs represents the “Total” compensation reported in the Summary Compensation Table for the applicable fiscal year, adjusted as follows: | | | | | | | | | | | | | | | | | | | | | | Adjustments | 2023 | 2022 | 2021 | | PEO | Average Non-PEO NEOs | PEO | Average Non-PEO NEOs | PEO | Average Non-PEO NEOs | | Deduction for “Stock Awards” in the Summary Compensation Table for Applicable Fiscal Year | (5,288,374) | | (1,888,005) | | ($2,299,996) | | ($612,501) | | ($2,179,744) | | ($721,439) | | | Deduction for “Option Awards” in the Summary Compensation Table for Applicable Fiscal Year | — | | — | | — | | — | | — | | — | | | Increase Based on ASC 718 Fair Value of Awards Granted during Applicable Fiscal Year that Remain Unvested | 4,923,036 | | 2,158,064 | | 1,879,153 | | 500,429 | | 2,136,895 | | 618,378 | | | Increase Based on ASC 718 Fair Value of Awards Granted during Applicable Fiscal Year that Vested during Applicable Fiscal Year, Determined as of Vesting Date | — | | — | | — | | — | | — | | — | | | Increase/deduction for Awards Granted during Prior Fiscal Years that were Outstanding and Unvested as of Applicable Fiscal Year, Determined Based on Change in ASC 718 Fair Value from Prior Fiscal Year End to Applicable Fiscal Year End | (839,225) | | (146,221) | | (656,222) | | (181,919) | | 527,600 | | 115,082 | | | Increase/deduction for Awards Granted during Prior Fiscal Years that Vested During Applicable Fiscal Year, Determined Based on Change in ASC 718 Fair Value from Prior Fiscal Year End to Vesting Date | 315,495 | | 55,003 | | (121,743) | | (48,647) | | 289,089 | | 106,521 | | | Increase Based on Dividends or Other Earnings on Stock Awards Paid during Applicable Fiscal Year | — | | — | | — | | — | | — | | 9,778 | | | Deduction of ASC 718 Fair Value of Awards Granted during Prior Fiscal Year that were Forfeited during Applicable Fiscal Year, Determined as of Prior Fiscal Year End | — | | — | | — | | — | | — | | — | | | Increase/deduction Based on Incremental ASC 718 Fair Value of Options during Applicable Fiscal Year | — | | — | | — | | (32,585) | | — | | 144,306 | | | Total Adjustments | $ | (889,068) | | $ | 178,841 | | $ | (1,198,808) | | $ | (375,223) | | $ | 773,840 | | $ | 272,626 | |
48Frontier Airlines 2024 Proxy Statement
EXECUTIVE COMPENSATION TABLES (continued) Narrative Disclosures to Pay Versus Performance Table The graphs below compare the CAP to our PEO and the average of the CAP to our non-PEO NEOs, with (i) our cumulative TSR and our Peer Group TSR, (ii) our net income (loss), and (iii) our Adjusted Pre-Tax Margin, in each case, for the fiscal years ended December 31, 2023, 2022 and 2021. TSR amounts reported in the graph assume an initial fixed investment of $100 as of April 1, 2021, the date of our initial public offering, and that all dividends, if any, were reinvested. Compensation Actually Paid and Company and Peer Group Cumulative TSR The chart below compares the CAP to our PEO and the average of our non-PEO NEOs with our cumulative TSR and our Peer Group TSR.
Frontier Airlines 2024 Proxy Statement 49
EXECUTIVE COMPENSATION TABLES (continued) Compensation Actually Paid and Net Income (Loss) The chart below compares the CAP to our PEO and the average of our non-PEO NEOs with our net income (loss).
50Frontier Airlines 2024 Proxy Statement
EXECUTIVE COMPENSATION TABLES (continued) Compensation Actually Paid and Adjusted Pre-Tax Margin The chart below compares the CAP to our PEO and the average of our non-PEO NEOs with our Adjusted Pre-Tax Margin. Financial Performance Measures We believe the following performance measures represent the most important financial performance measures used by us to link compensation actually paid to our PEO and non-PEO NEOs for the fiscal year ended December 31, 2023: •Adjusted Pre-Tax Margin (non-GAAP); •Year-end Net Cash; •Total Adjusted CASM (non-GAAP); and •Adjusted Net Margin (non-GAAP). Our annual incentives also include operational goals that are inclusive of the following metrics: Aircraft Availability at Start of Day, Controllable Turn Performance, DOT Mishandled Bag Rate (Industry Rank), and Head Start On-Time Percentage. For additional details regarding our most important financial performance measures, please see “Compensation Discussion and Analysis—Performance-Based Cash Incentives.” Frontier Airlines 2024 Proxy Statement 51
EXECUTIVE COMPENSATION TABLES (continued) (5)
| Represents a lump sum cash payment of 24 months of base salary. |
(6)
| Represents a lump sum cash payment of two times a NEO’s target annual performance bonus amount. In addition, for Messrs. Biffle and Dempsey, represents a pro-rated annual performance bonus for the year in which the termination occurs (based on actual performance and payable at the same time other continuing executives) in the event of a termination without Cause or for Good Reason. For Messrs. Biffle’s and Dempsey’s pro-rated bonuses, we included the full amount each was paid for fiscal year 2021 under the Management Bonus Plan since the assumed termination date would be December 31, 2021. |
(7)
| Represents the aggregate value of Mr. Biffle’s and Mr. Dempsey’s restricted stock units and unvested option awards that would have vested on an accelerated basis immediately prior to a qualifying termination following the consummation of a Change in Control, based on the closing trading price of our common stock ($13.57) as of December 31, 2021, less, in the case of an option with an exercise price less than fair market value, the option’s exercise price. Mr. Biffle and Mr. Dempsey each receive 100% accelerated vesting of their respective equity awards in the event of a termination without Cause or for Good Reason, in each case, within 12 months following a Change in Control. |
(8)
| Represents continued coverage under COBRA for 24 months for each NEO based on the incremental cost of our contribution as of December 31, 2021 to provide this coverage. Messrs. Diamond, Maccubbin and Filene are not eligible for any continued coverage under COBRA. |
(9)
| Represents the value of continued UATP flight benefits for two years following the NEOs’ termination of employment, within 12 months following a Change in Control, which must be used in the two years following termination, based on the values each NEO was eligible to receive under the UATP for fiscal 2021. |
(10)
| Represents the aggregate value of restricted stock units held by Messrs. Diamond, Maccubbin and Filene that would have vested in full on a change in control, in accordance with the terms of the award agreements under the 2014 Plan, based on the closing trading price of our common stock ($13.57) as of December 31, 2021. |
Equity Compensation Plan Information
The following table provides certain information with respect to all of our equity compensation plans in effect as of December 31, 2021:2023:
Equity compensation plans approved by stockholders(1) | | | 9,621,701(2) | | | $1.99 | | | 7,058,244 (3) |
Equity compensation plans not approved by stockholders | | | — | | | — | | | — |
Total | | | 9,621,701 | | | $1.99 | | | 7,058,244 |
(1) | | | | | | | | | | | | | Plan Category | Number of shares to be issued upon exercise of outstanding
options and rights | Weighted-
average exercise
price of outstanding
options and rights | Number of shares remaining available for future issuance under equity compensation plans | Equity compensation plans approved by stockholders(1) | 9,801,055 (2) | $ | 4.27 | | 5,288,546 (3) | | Equity compensation plans not approved by stockholders | — | — | | — | | Total | 9,801,055 | $ | 4.27 | | 5,288,546 |
(1)Consists of the 2014 Plan and the 2021 Plan. (2)Consists of 3,022,467 options and 213,836 RSUs outstanding under the 2014 Plan and 6,564,752 RSUs outstanding under the 2021 Plan. (3)Consists of 5,288,546 shares of common stock available for issuance under the 2021 Plan, excluding 9,801,055 shares to be issued upon exercise of outstanding options and rights. | Consists of the 2014 Plan and the 2021 Plan. |
(2)
| Consists of 7,651,407 options and 1,766,236 RSUs outstanding under the 2014 Plan and 204,058 RSUs outstanding under the 2021 Plan. |
(3)
| Consists of 7,058,244 shares of common stock available for issuance under the 2021 Plan. |
(4)
| Excluding 9,621,701 shares to be issued upon exercise of outstanding options, warrants and rights. |
The number of shares initially reserved for issuance or transfer pursuant to awards under the 2021 Plan will be increased by (i) the number of shares represented by outstanding awards under our 2014 Plan that are forfeited or lapse unexercised and which following the effective date are not issued under our 2014 Plan and (ii) an annual increase on the first day of each fiscal year beginning in 2022 and ending in 2031, equal to the lesser of (A) one percent (1%) of the shares of stock outstanding (on an as converted basis) on the last day of the immediately preceding fiscal year and (B) such smaller number of shares of stock as determined by our Board.
Compensation Risk Assessment
In February 2022,2023, the Compensation Committee was presented with the results of management’s analysis on our compensation policies and practices for our employees to determine if these policies and practices give rise to risks that are reasonably likely to have a material adverse effect on us or encourage our employees to take excessive risks